Why Chart.JS
Chart.js is a Javascript library that allows designers and developers to draw all kinds of charts using the HTML5 canvas element.
Chart.js offers a great array of simple, clean charts including animated and interactive versions. It's an easy way to include beautiful and engaging charts into your website for free.
Objective
In this blog we will be trying to build a simple Cryptocurrency price website, and will be making use of chart.js to plot the price chart.
we will also be making use of CoinGeckos free Cryptocurrency data API to fetch the data for our charts.
Getting Started
Let's get started by generating a basic next-app for us to work with using create-next-app
npx create-next-app next-chartjs-example
Let's install the required chart.js dependency for our project by running:
# If you're using npm
npm install chart.js react-chartjs-2

# If you're using yarn
yarn add chart.js react-chartjs-2
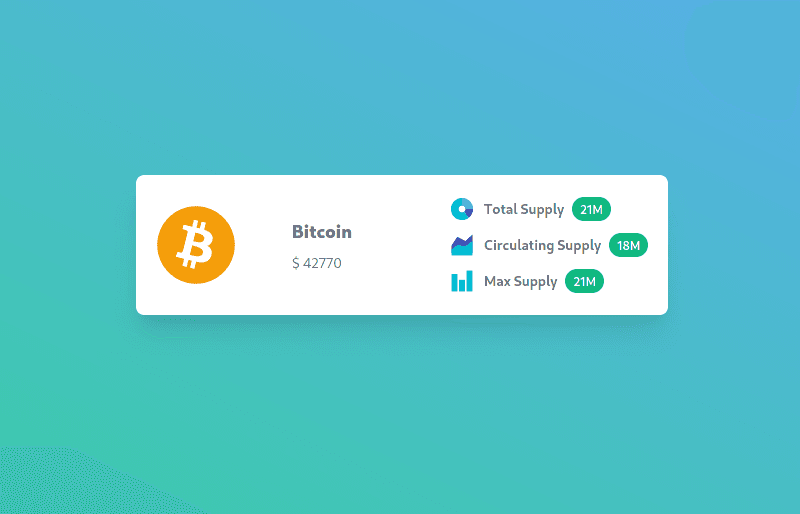
With that out of the way let's just create a simple block with the coins info currently it is hardcoded in, but you can use the data from the API to replace with these later. I'll be using TailwindCSS to style our component.

Here's our index.jsx file we've added a simple info block.
import { FaBitcoin } from 'react-icons/fa';
import { FcAreaChart, FcBarChart, FcDoughnutChart } from 'react-icons/fc';

const Home = () => {
  return (
    <section className="flex h-screen items-center justify-center bg-gradient-to-tr from-green-400 to-blue-400">
      <div className="mx-5 max-w-4xl bg-white rounded-lg shadow-xl">
        <div className="flex items-center justify-center p-5 space-x-5">
          <FaBitcoin className="w-20 h-20 text-yellow-500" />
          <div className="flex flex-col space-y-2">
            <h2 className="text-lg font-black text-gray-500">Bitcoin</h2>
            <p className="text-sm text-gray-500">$ 42770</p>
          </div>
          <div className="flex flex-col space-y-2 pl-10">
            <div className="flex items-center space-x-2">
              <FcDoughnutChart className="w-7 h-7" />
              <p className="text-sm text-gray-500 font-bold">Total Supply</p>
              <span className="text-xs font-bold text-white bg-green-500 px-2 py-1 rounded-full">
                21M
              </span>
            </div>
            <div className="flex items-center space-x-2">
              <FcAreaChart className="w-7 h-7" />
              <p className="text-sm text-gray-500 font-bold">
                Circulating Supply
              </p>
              <span className="text-xs font-bold text-white bg-green-500 px-2 py-1 rounded-full">
                18M
              </span>
            </div>
            <div className="flex items-center space-x-2">
              <FcBarChart className="w-7 h-7" />
              <p className="text-sm text-gray-500 font-bold">Max Supply</p>
              <span className="text-xs font-bold text-white bg-green-500 px-2 py-1 rounded-full">
                21M
              </span>
            </div>
          </div>
        </div>
      </div>
    </section>
  );
};

export default Home;
Now let's use getServerSideProps to fetch the day's Bitcoin price chart from CoinGecko's API.
Note: we will be using getServerSideProps because Cryptocurrency prices changes every few seconds and we want to provide the latest prices to the users on every request.
So in our index.jsx file let's add the logic to fetch the present day's prices.
export const getServerSideProps = async () => {
  const _cg_api = 'https://api.coingecko.com/api/v3';

  const marketData = await fetch(
    `${_cg_api}/coins/bitcoin/market_chart?vs_currency=usd&days=1&interval=hourly`
  ).then((res) => res.json());

  return {
    props: {
      marketData: marketData
    }
  };
};
Once that's been added our current index.jsx file should look something like this
import { FaBitcoin } from 'react-icons/fa';
import { FcAreaChart, FcBarChart, FcDoughnutChart } from 'react-icons/fc';

const Home = (props) => {
  return (
    <section className="flex flex-col mx-auto h-screen items-center justify-center bg-gradient-to-tr from-green-400 to-blue-400 space-y-10">
      <div className="mx-5 max-w-4xl bg-white rounded-lg shadow-xl">
        <div className="flex items-center justify-center p-5 space-x-14">
          <FaBitcoin className="w-20 h-20 text-yellow-500" />
          <div className="flex flex-col space-y-2">
            <h2 className="text-lg font-black text-gray-500">Bitcoin</h2>
            <p className="text-sm text-gray-500">$ 42770</p>
          </div>
          <div className="flex flex-col space-y-2 pl-10">
            <div className="flex items-center space-x-2">
              <FcDoughnutChart className="w-7 h-7" />
              <p className="text-sm text-gray-500 font-bold">Total Supply</p>
              <span className="text-xs font-bold text-white bg-green-500 px-2 py-1 rounded-full">
                21M
              </span>
            </div>
            <div className="flex items-center space-x-2">
              <FcAreaChart className="w-7 h-7" />
              <p className="text-sm text-gray-500 font-bold">
                Circulating Supply
              </p>
              <span className="text-xs font-bold text-white bg-green-500 px-2 py-1 rounded-full">
                18M
              </span>
            </div>
            <div className="flex items-center space-x-2">
              <FcBarChart className="w-7 h-7" />
              <p className="text-sm text-gray-500 font-bold">Max Supply</p>
              <span className="text-xs font-bold text-white bg-green-500 px-2 py-1 rounded-full">
                21M
              </span>
            </div>
          </div>
        </div>
      </div>
    </section>
  );
};

export const getServerSideProps = async () => {
  const _cg_api = 'https://api.coingecko.com/api/v3';

  const marketData = await fetch(
    `${_cg_api}/coins/bitcoin/market_chart?vs_currency=usd&days=1&interval=hourly`
  ).then((res) => res.json());

  return {
    props: {
      marketData: marketData
    }
  };
};

export default Home;
Now let's create a components/CoinPriceChart.jsx file, we will customize and the look and feel of our Charts in this file.
import { Line } from 'react-chartjs-2';

// import our custom configuration for our chart
import { Config } from './ChartConfig';

const CoinPriceChart = (props) => {
  //   this function will format our data to a much readable and
  //   useful form for chart.js
  const formatData = (data) => {
    // coingecko api provides the prices in an Array[Array[date, price]] format
    // so we will map throught each timestamp of the prices array
    return data.map((el) => {
      //   we will return the price & date values as an Array[Object{x: date, y: price}]
      //   which is in a datastructure that chart.js expects its input to be
      return {
        // lets convert our date to a localeString and use only the necessary
        // part like minutes and hours
        x: new Date(el[0]).toLocaleString().substr(11, 9),
        // also lets truncate our price to 2 decimal points for better redabililty
        y: el[1].toFixed(2)
      };
    });
  };

  //   we will provide some minor customizations for our chart
  //   and also its labels and inputs

  const data = {
    datasets: [
      {
        // label for our chart
        label: 'Bitcoin Price Chart',
        fill: true,
        data: formatData(props.prices),

        // color of the line chart
        borderColor: '#3B82F6',
        // partially transparent part below our line graph
        backgroundColor: 'rgba(59, 130, 246, 0.2)',
        borderWidth: 3,
        pointRadius: props.pointRadius,
        pointHoverRadius: 5,
        borderCapStyle: 'butt',
        pointHoverRadius: 5,
        pointHoverBackgroundColor: 'rgba(59, 130, 246, 1)',
        pointHoverBorderColor: 'rgba(59, 130, 246, 1)',
        pointHoverBorderWidth: 2
      }
    ]
  };

  //   and finally lets return a chart component with our api data and
  //   config
  return (
    <div className="chart-container w-full h-full p-2">
      <Line data={data} options={Config} />
    </div>
  );
};

export default CoinPriceChart;
Let's also create a compnents/ChartConfig.js file to provide our customization options.
export const Config = {
  plugins: {

    // show legends for our graph
    legend: {
      display: true,
    },
  },
  lineHeightAnnotation: {
    always: true,
    lineWeight: 1.5,
  },

//   animate in
  animation: {
    duration: 1,
  },
  maintainAspectRatio: false,
  responsive: true,

//   show the x and y scales
  scales: {
    x: { display: true },
    y: { display: true },
  },
};
Now with all the necessary files done let's plug these component into our index.jsx files
and see our result.
So let's import CoinPriceChart component to our index.jsx file.
import { FaBitcoin } from 'react-icons/fa';
import { FcAreaChart, FcBarChart, FcDoughnutChart } from 'react-icons/fc';
import CoinPriceChart from '../components/CoinPriceChart';

const Home = (props) => {
  return (
    <section className="flex flex-col mx-auto h-screen items-center justify-center bg-gradient-to-tr from-green-400 to-blue-400 space-y-10">
      <div className="mx-5 max-w-4xl bg-white rounded-lg shadow-xl">
        <div className="flex items-center justify-center p-5 space-x-14">
          <FaBitcoin className="w-20 h-20 text-yellow-500" />
          <div className="flex flex-col space-y-2">
            <h2 className="text-lg font-black text-gray-500">Bitcoin</h2>
            <p className="text-sm text-gray-500">$ 42770</p>
          </div>
          <div className="flex flex-col space-y-2 pl-10">
            <div className="flex items-center space-x-2">
              <FcDoughnutChart className="w-7 h-7" />
              <p className="text-sm text-gray-500 font-bold">Total Supply</p>
              <span className="text-xs font-bold text-white bg-green-500 px-2 py-1 rounded-full">
                21M
              </span>
            </div>
            <div className="flex items-center space-x-2">
              <FcAreaChart className="w-7 h-7" />
              <p className="text-sm text-gray-500 font-bold">
                Circulating Supply
              </p>
              <span className="text-xs font-bold text-white bg-green-500 px-2 py-1 rounded-full">
                18M
              </span>
            </div>
            <div className="flex items-center space-x-2">
              <FcBarChart className="w-7 h-7" />
              <p className="text-sm text-gray-500 font-bold">Max Supply</p>
              <span className="text-xs font-bold text-white bg-green-500 px-2 py-1 rounded-full">
                21M
              </span>
            </div>
          </div>
        </div>
      </div>
      <div className="mx-5 max-w-4xl w-1/3 h-1/2 rounded-lg shadow-xl bg-white">
        <CoinPriceChart {...props.marketData} />
      </div>
    </section>
  );
};

export const getServerSideProps = async () => {
  const _cg_api = 'https://api.coingecko.com/api/v3';

  const marketData = await fetch(
    `${_cg_api}/coins/bitcoin/market_chart?vs_currency=usd&days=1&interval=hourly`
  ).then((res) => res.json());

  return {
    props: {
      marketData: marketData
    }
  };
};

export default Home;
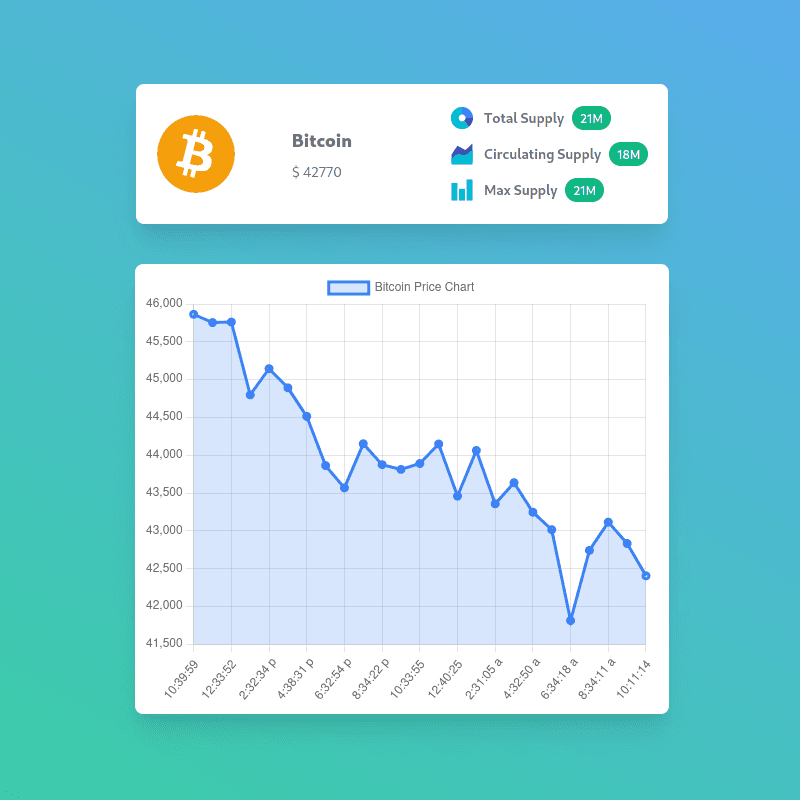
And here we have our main page with a proper Price chart.

And there we have it a cool Cryptocurrency Price chart in Next JS with the help of Chart JS, you can further customize the Chart and configure it by following the following Configuration Docs
We have only used a simple Line Chart here but you can make use of different Chart Types provided by Chart.js
The latest Docs for Chart.js can be found here @Chart Docs
